Understanding Dashboards
Last updated: September 25, 2026
An introduction to creating, organizing and sharing dashboards in Polar.
What's a dashboard?
Dashboards are pages you build in Polar with the metrics and visualizations you care about most. Use them for ad-hoc investigations or regular reporting, and send them to your team on a schedule by email or Slack.
What can a dashboard contain?
Block | What it's for |
Card Grids | Sections of headline metrics you want to keep a close eye on, shown as Metric Cards (a single value) or Sparkline Cards (a value with a small trend chart). Cards support targets, so you can track progress toward your goals. |
Tables and charts | Visualizations you build from metrics, dimensions, date granularities and filters. |
For chart types, card types and how to build each one, see Building Custom Dashboards: Charts & Cards.
Create a dashboard
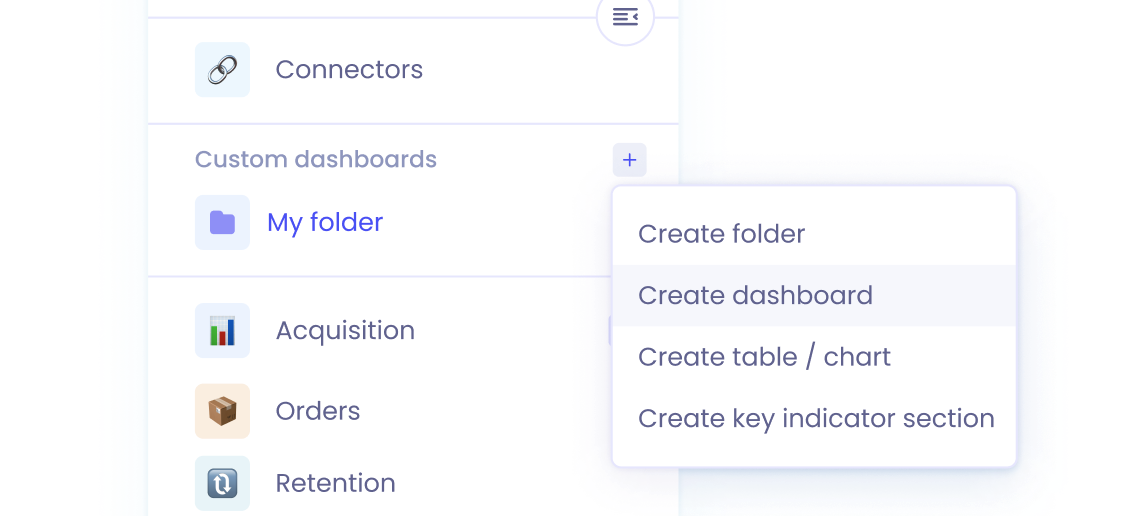
Click the + button at the top of the menu, or next to an existing folder, and choose Create dashboard.
You can also build a dashboard with AI by describing what you want to Ask Polar.
Add content to a dashboard
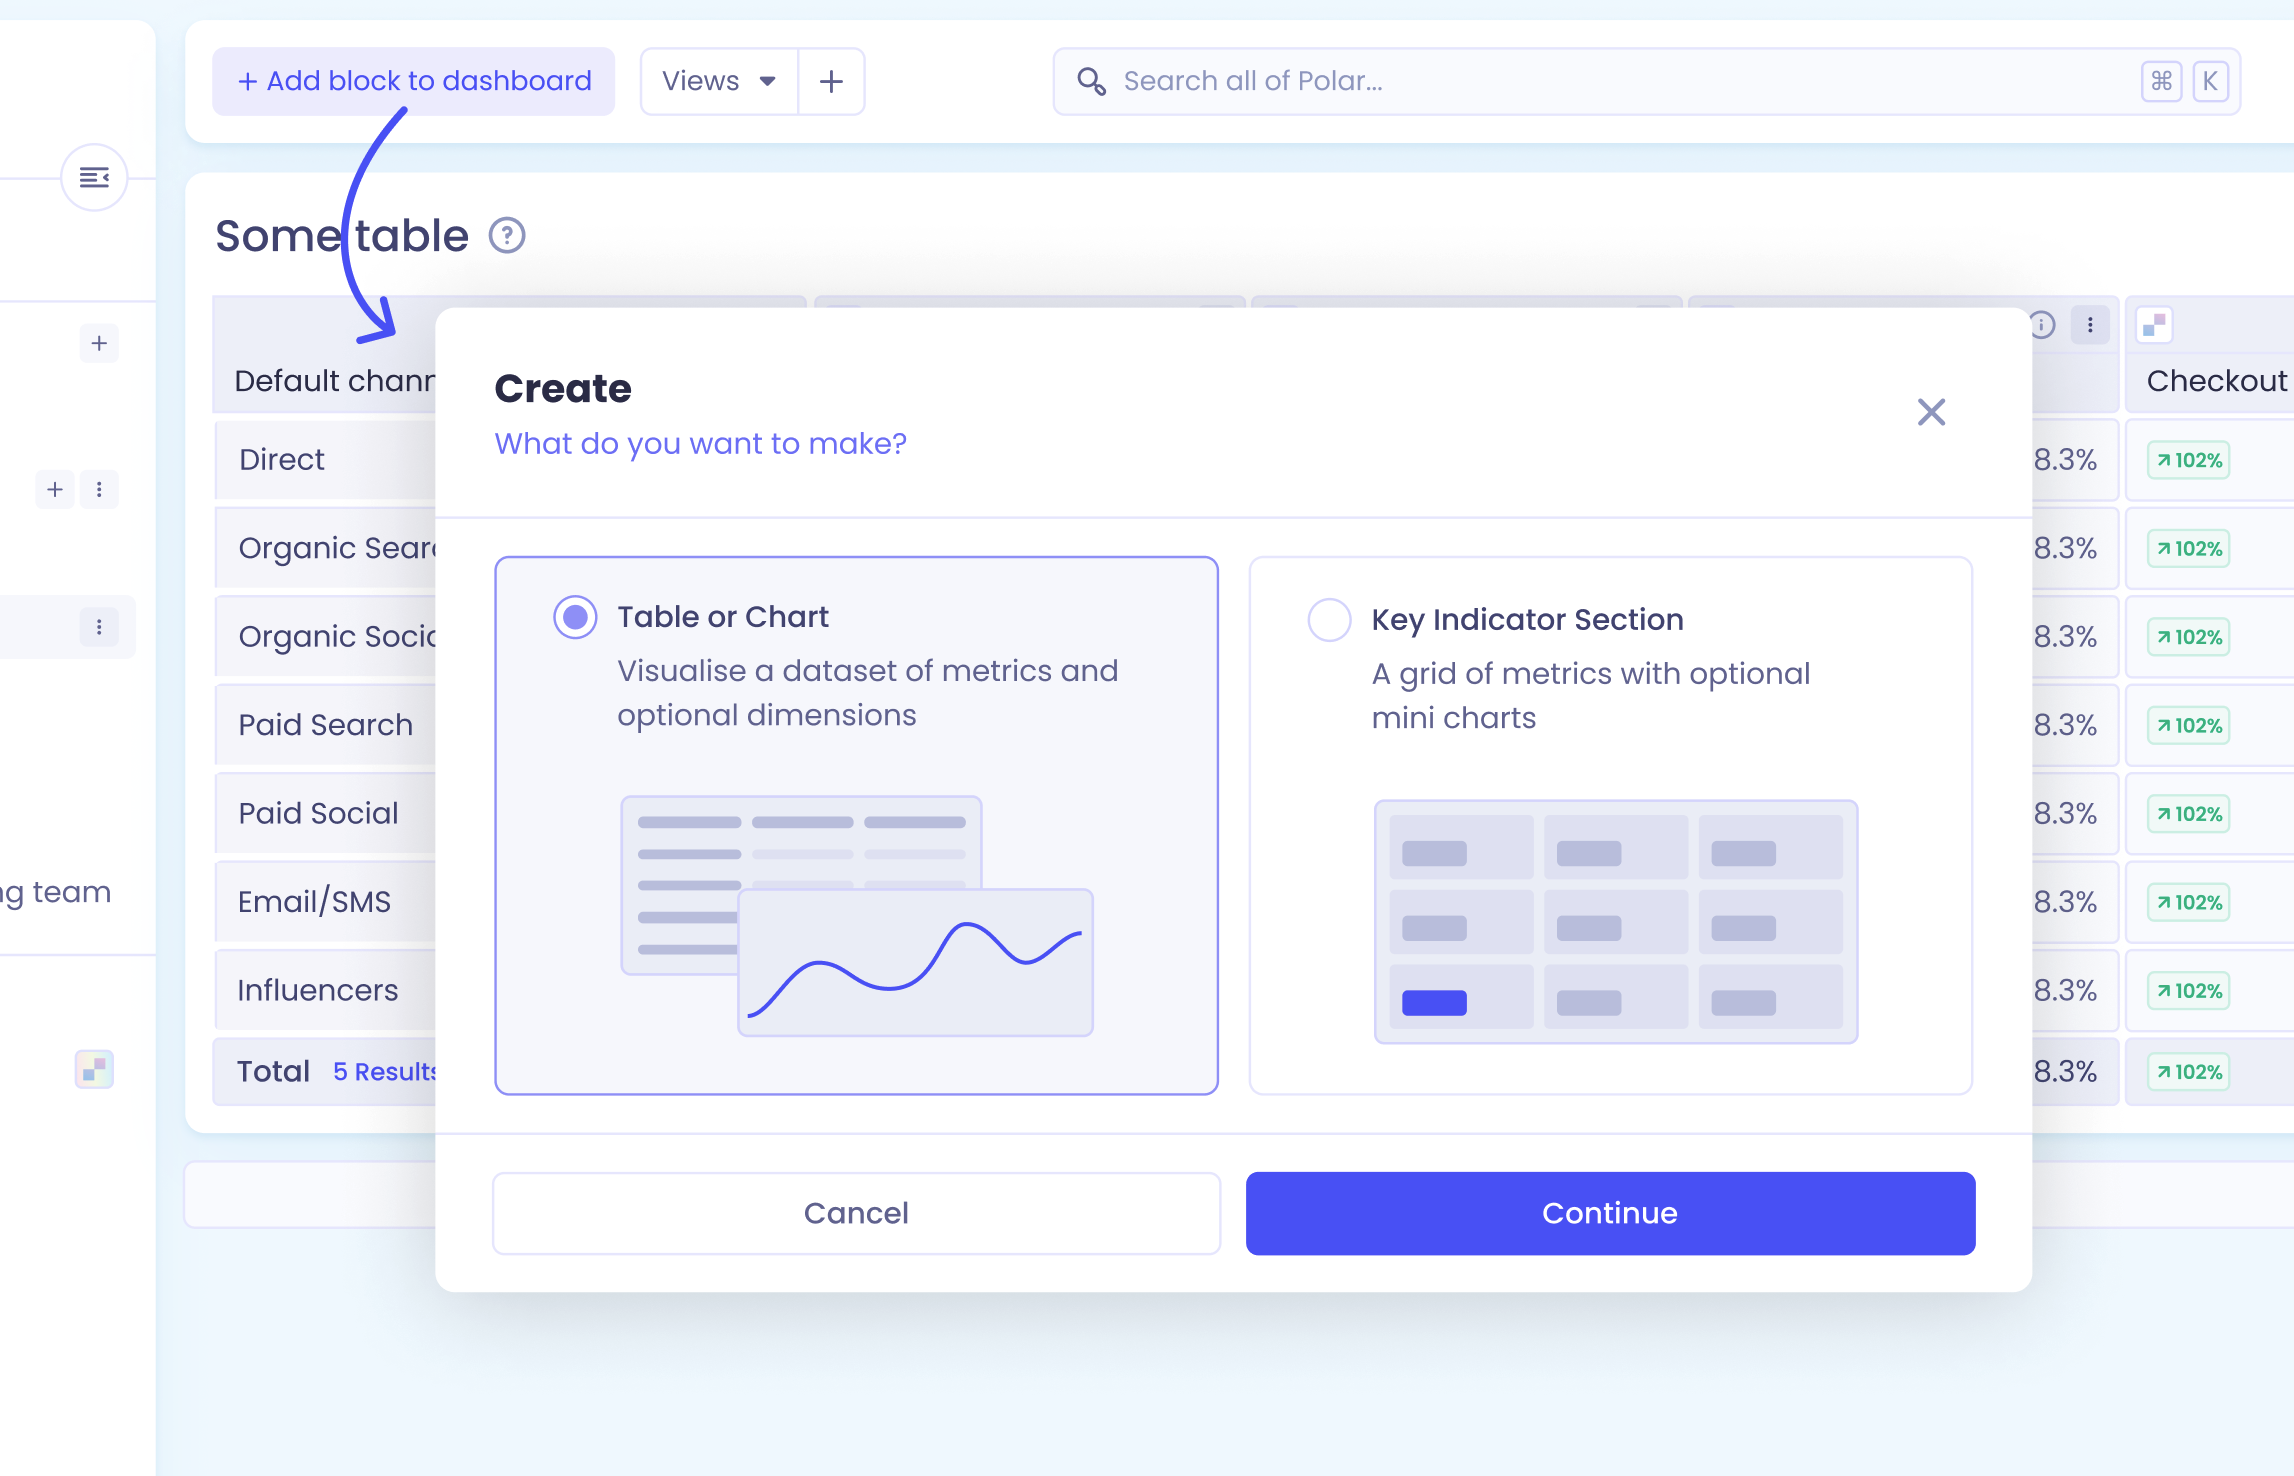
While viewing a dashboard, click + Add block to dashboard in the header.
Organize your dashboards
Dashboards live inside folders in the top section of the main menu. Use folders to group related dashboards together. You can:
Rename dashboards and folders
Move blocks between dashboards in the same folder
Move dashboards between folders
Tip: to see the same dashboard with different filters applied, create a View instead of duplicating the dashboard. That way there's only one copy to maintain.
Who can see and edit dashboards
All folders and dashboards are visible to every active user in your workspace. Users with the Viewer role can view folders and dashboards, but can't edit them.
Send dashboards by email or Slack
Add blocks from any dashboard to an Automation to send them regularly by email or Slack. See Understanding Automations.
To get dashboard data into a spreadsheet or another tool, see Exporting Data in Polar.