Understanding Custom Tables & Charts
Last updated: September 25, 2026
Custom tables and charts (previously called Custom Reports) let you build your own views of your data, choosing exactly which metrics, dimensions and filters to use. Use them to answer questions your standard dashboards don't cover, investigate a change in performance, or prototype an analysis before adding it to a shared dashboard.
Example: revenue dipped last week. A custom table can quickly show whether that's down to fewer orders, lower AOV or a specific acquisition channel, without changing an existing dashboard.
Build a custom table or chart
Tip: the fastest way is to describe what you want to Ask Polar, such as the metrics, how to break them down and the time frame, and it will build the table for you. You can also use Ask Polar if a table doesn't look right.
To build one yourself, open the custom table builder, or start from a template. Then:
Start with a question. Decide what you want to understand and which metric best represents it.
Add metrics and dimensions. Metrics are what you measure (for example, Net Sales, Orders or Conversion Rate). Dimensions are how results are grouped (for example, Date, Channel or Product). Start with one metric and one dimension, and add more only if you need them. You can also create your own custom metrics and custom dimensions.
Add filters to focus on what matters, such as a specific channel, product or customer segment. You can combine filters and include or exclude specific values.
Set the date range and granularity (daily, weekly, monthly and so on). Use finer granularity for short-term analysis and broader granularity for long-term trends.
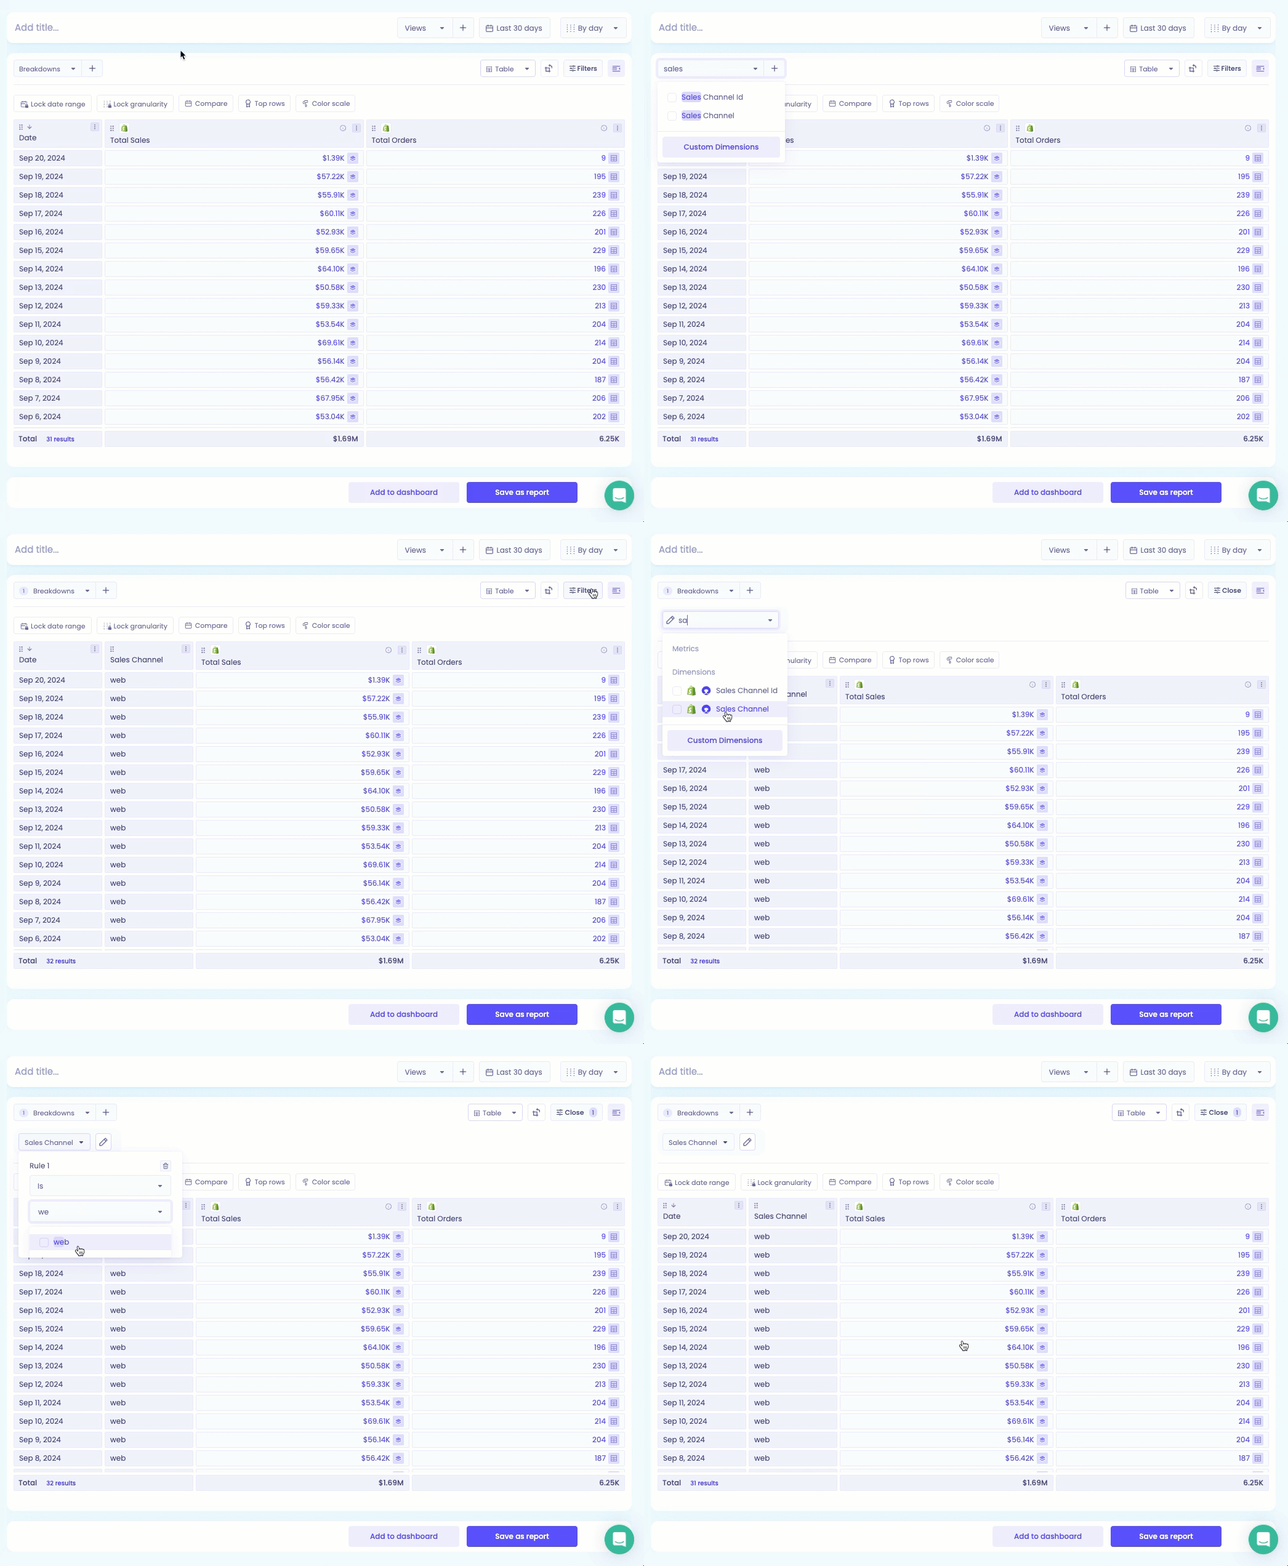
In this example, the data is broken down by sales channel and filtered to show only web channel data:
Lock the date range
A locked date keeps the table on a fixed period, whatever date range is selected elsewhere. This is useful for financial reporting and month-end close.
Compare with a previous period
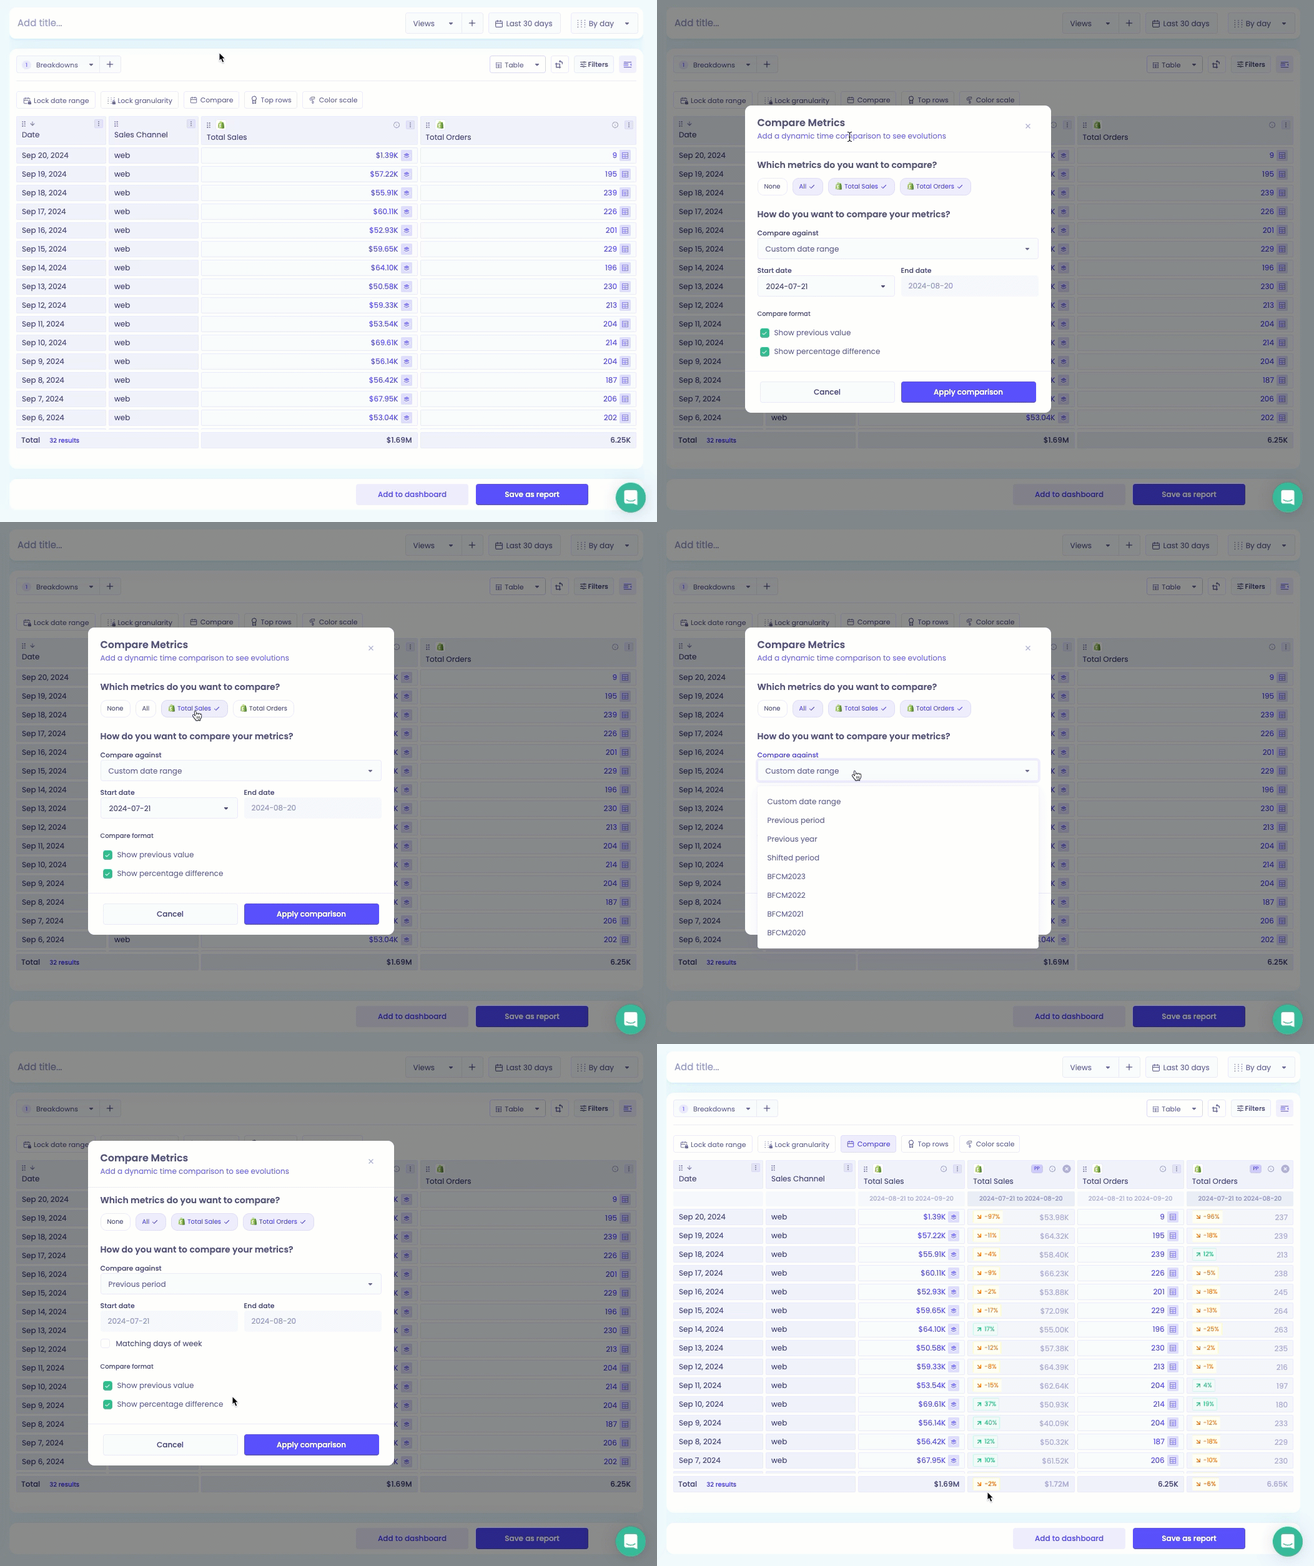
Add a comparison to see how each metric has changed against the previous period or the same period last year. Comparisons for custom tables are set in the table editor, not with the dashboard's date picker. See Comparing time periods.
Customize how data is displayed
Show only the top or bottom rows
To focus on your best or worst performers, such as your top 10 products by revenue:
In the Table view, click Show Top Rows.
Choose the metric to rank by (for example, Total Sales).
Choose how many rows to show.
Choose whether to show the highest or lowest values first.
Click Save report limit. A badge on the table shows the limit, and you can hover over it to see the settings.
Other display options
Option | What it does |
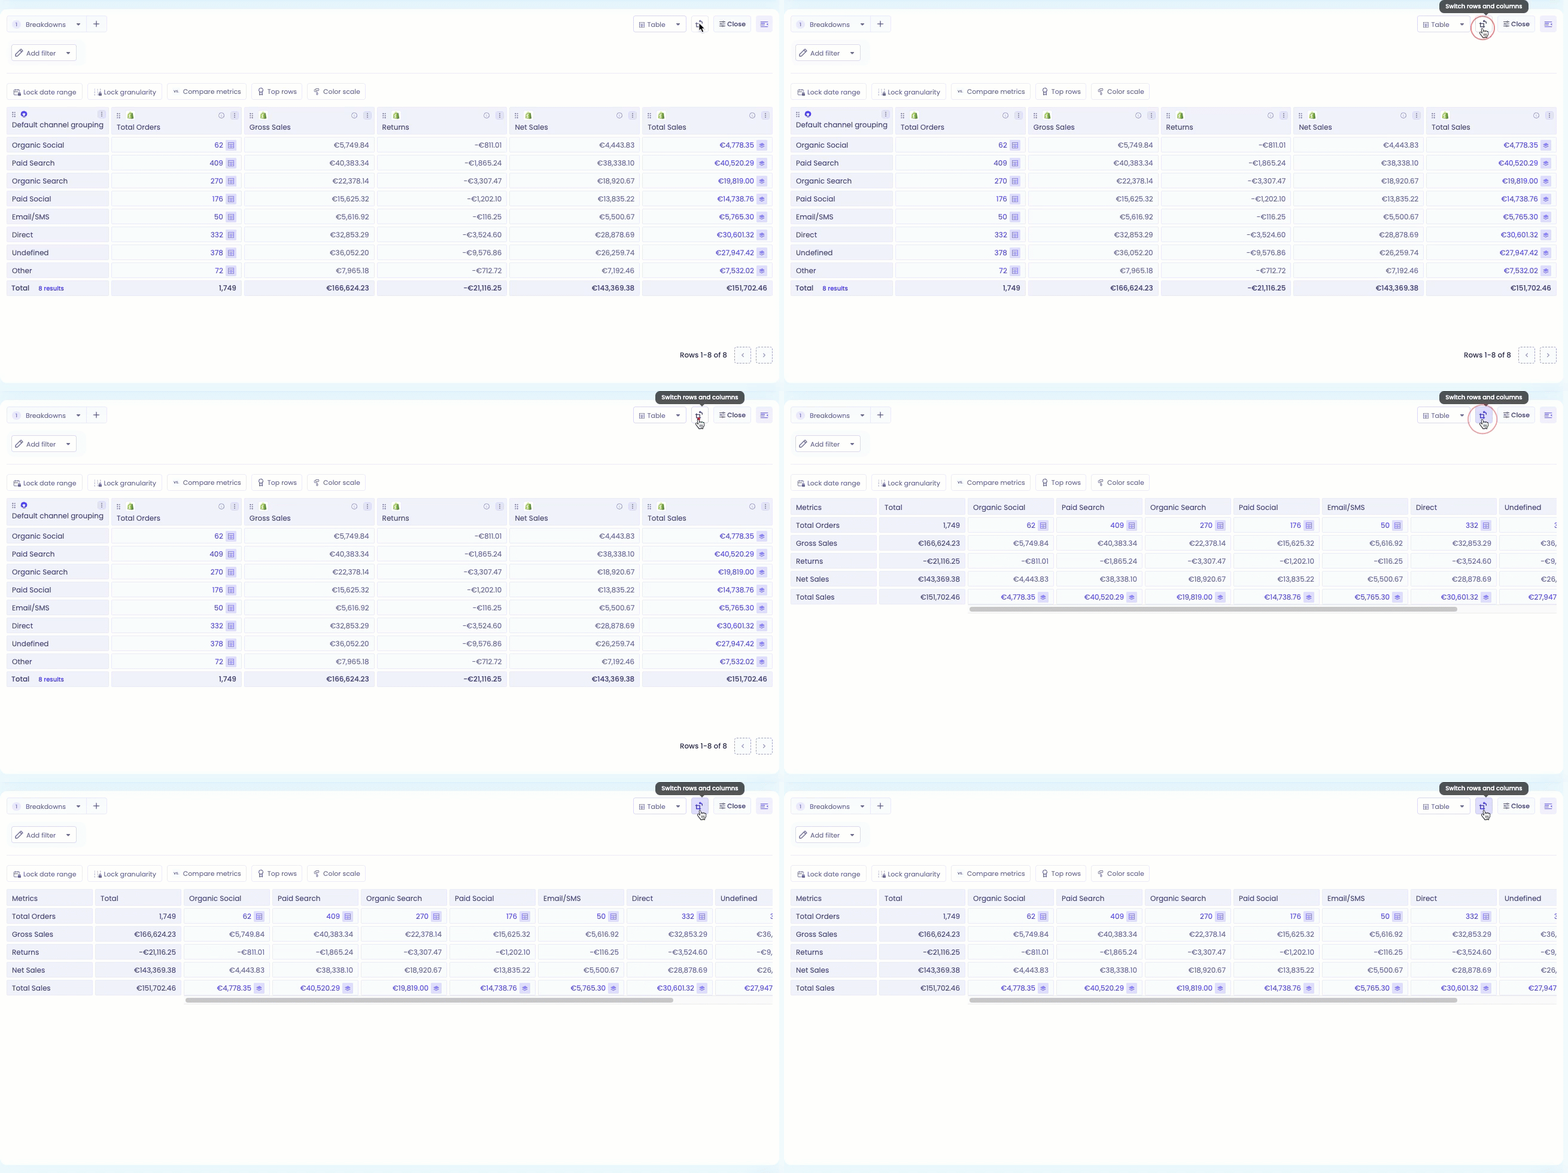
Switch rows and columns | Flips the table's layout. This is useful when comparing several metrics across one dimension, or when a table is too wide to read. |
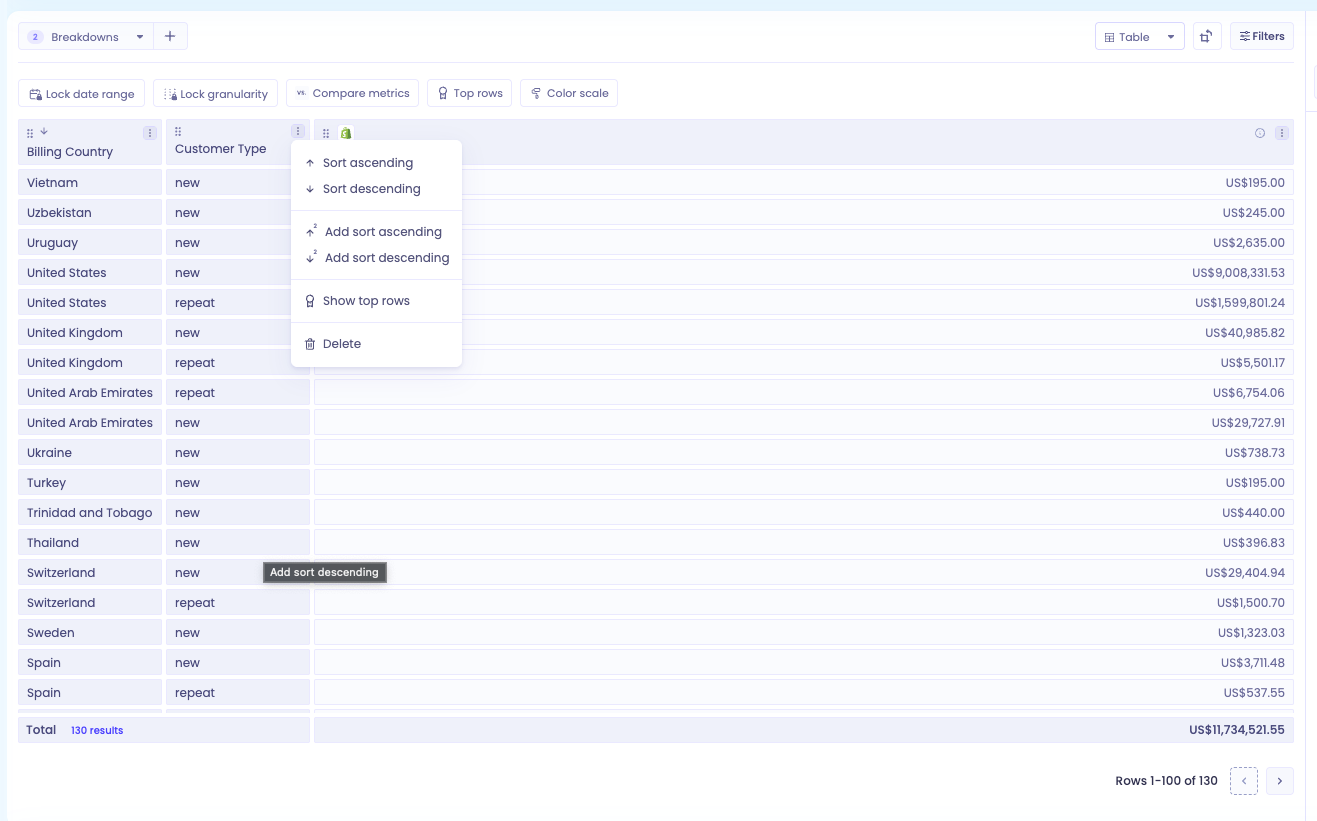
Multi-column sorting | Sorts by several metrics and dimensions at once. Open a column's menu and choose Add sort ascending or Add sort descending, or hold Shift and click a column header. A number next to each sort shows the order they're applied in. |
Color Scales | Colors values by thresholds you set, so strong and weak performers stand out. See Customizable Color Scales. |
Tables or charts?
View | Best for |
Table | Exact values, detailed comparisons and analysis across several metrics |
Chart | Trends over time, spotting patterns and presenting to others |
You can switch between the two at any time. If an insight isn't obvious in one view, try the other. For chart types and how charts appear on dashboards, see Building Custom Dashboards: Charts & Cards.
Send tables on a schedule
Add custom tables to an Automation to send them to your team by email or Slack on a regular schedule, such as for weekly performance reviews or monthly reporting. See Understanding Automations.
Note: custom charts can't currently be added to Automations.
Troubleshooting
If your totals don't add up, you see a blank row, or your numbers don't match another report, see Troubleshooting custom tables.