Troubleshooting custom tables
Last updated: September 25, 2026
If a custom table doesn't look right, it's usually down to how the table is set up rather than a data problem. This article covers the most common issues and how to fix them.
Tip: describe what you're seeing to Ask Polar. It can check your table's setup and often explain the difference straight away.
The total doesn't equal the sum of the rows
This is expected in two situations.
1. The table includes an average or ratio metric
For metrics like Average Order Value (AOV), ROAS or Conversion Rate, the total row isn't the sum of the rows. It's calculated with the metric's formula across all your data. For example, the AOV total is:
Total Sales ÷ Total Orders
Adding up each row's AOV would give a meaningless number, so the total row shows the true average instead. Trust the total row for these metrics.
2. The table is broken down by a dimension that can have several values per order
Some dimensions can have more than one value for the same order, such as Order Tag, Discount Code, Product Tag or Customer Tag. When you break down by one of these, an order with two tags appears in two rows, once under each tag.
So the rows add up to more than the real total, because the same order is counted in several rows. The total row accounts for this and counts each order only once.
An exported file's totals don't match Polar
This happens for the same reason as above. If your table is broken down by a dimension like Discount Code, an order with two discount codes appears in two rows of the export, each with the order's full value. Summing the column in a spreadsheet then double-counts that order.
To reconcile an export:
Use the totals shown in Polar for reporting.
Or add an Order ID column to your export and remove duplicate orders before summing.
There's a blank row in my table
When you break down by a product dimension such as Product Title or SKU, you may see a row with no name. It holds sales that aren't tied to a specific product, such as shipping, taxes, fees or order edits. It can also appear if some sales records are missing product data.
To remove the blank row, add the filter Product Title is not null (or the same for the dimension you're using).
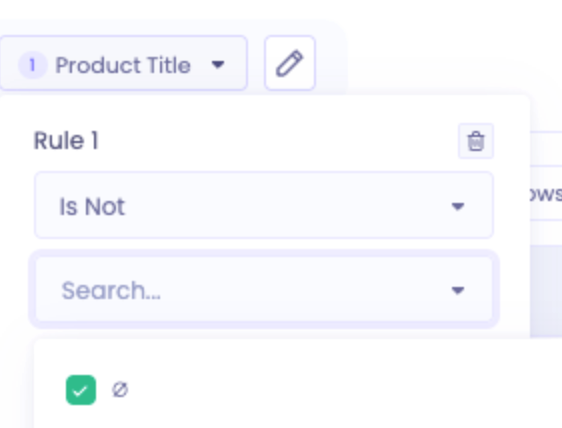
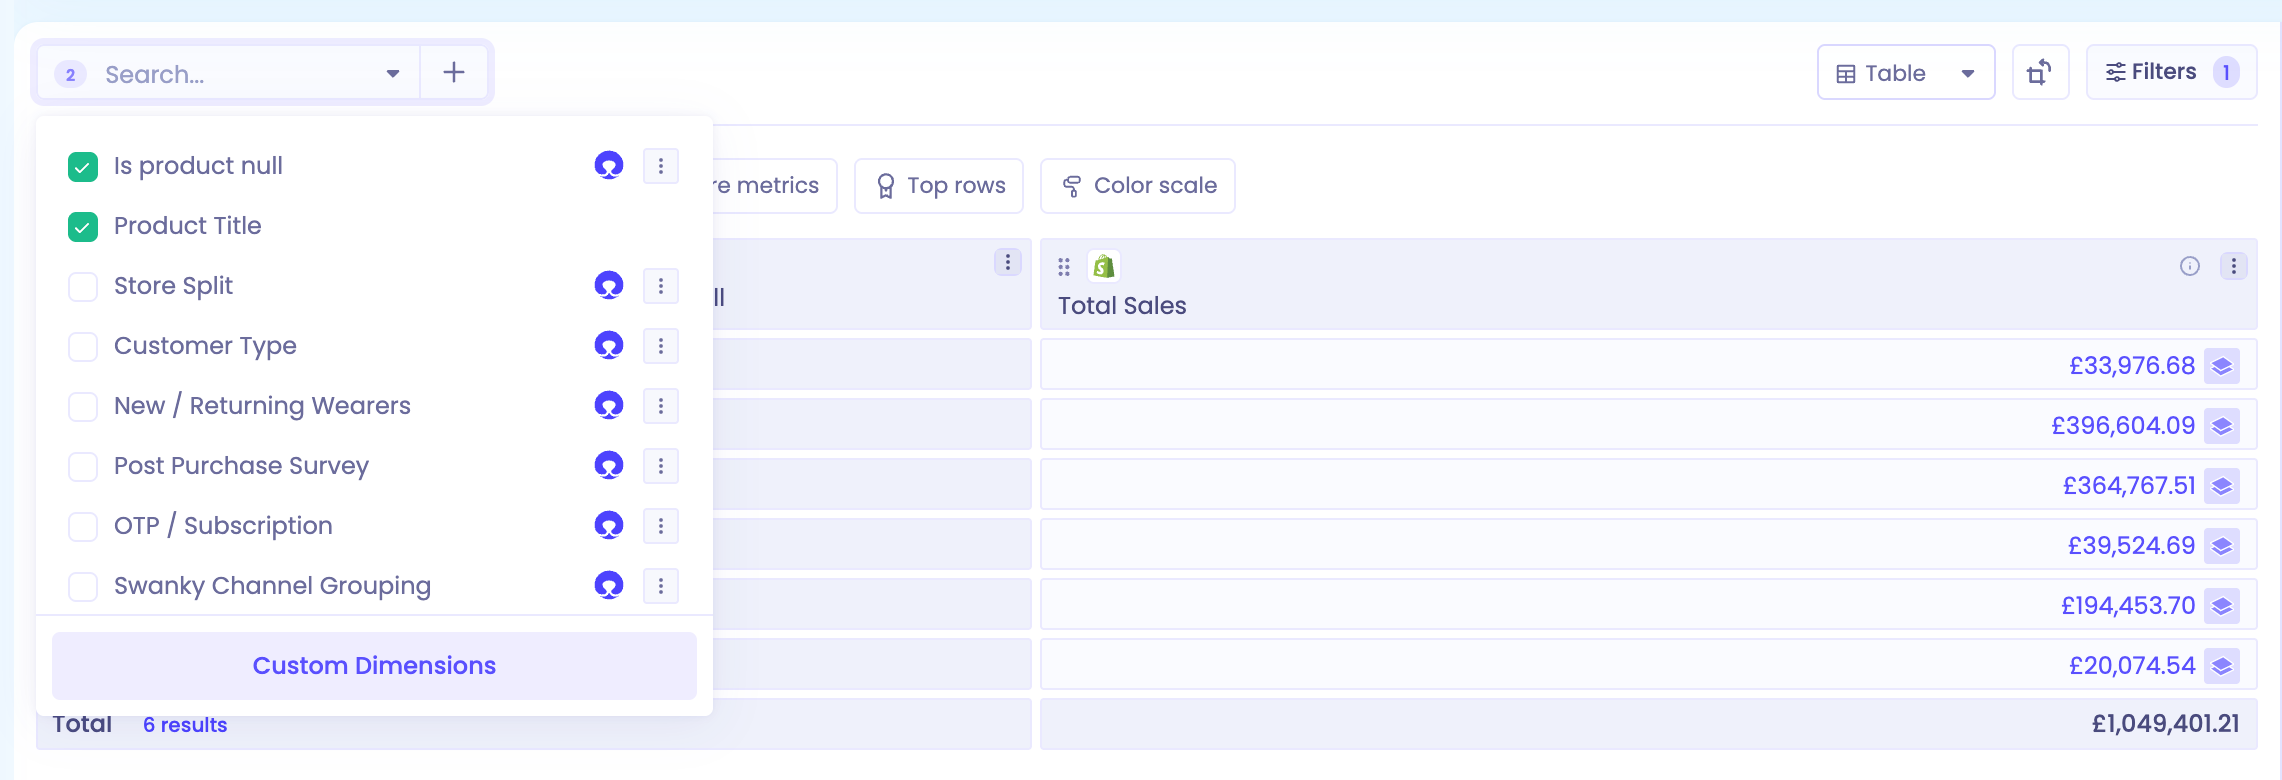
If you use this often, you can save it as a custom dimension, so you can see product sales without shipping, discounts and order edits mixed in.
Numbers don't match another report or dashboard
Small setup differences lead to different results. Compare the two reports for:
Date range and granularity (for example, daily vs. monthly)
Filters, including filters a pre-built report applies automatically
Metric definitions (for example, Gross Sales vs. Net Sales)
Locked dates on the table
Breakdowns that repeat orders across rows (see above)
To see exactly what a pre-built report applies, open it in the table editor and review its filters and breakdowns.
Data looks missing or incomplete
Loosen or remove filters.
Check that the date range contains data.
Check whether a Top / Bottom rows limit is hiding rows.
Check that your metrics and dimensions are compatible. Not every dimension can break down every metric.
Check that the data source is connected and synced on the Connectors page.
Comparison values look wrong
Check which comparison is selected: previous period or previous year.
Check for partial periods, such as comparing a month in progress against a full month.
Make sure granularity is the same across both periods.
See Comparing time periods for how comparisons work.
An Automation looks different from the table
Open the saved table to confirm its current setup.
Check for recent changes to filters or dates.
If you need the same fixed period every time, use a locked date instead of a dynamic one.
Still stuck? Reach out through the in-app chat.