Customizable Color Scales
Last updated: September 25, 2026
Color Scales apply color-coded thresholds to your metrics, so you can spot outliers, trends and problem areas at a glance, even in large tables with dozens of campaigns or metrics.
You can use Color Scales in any custom table and in any table in the Acquisition tab.
Turn on Color Scales
In a custom table
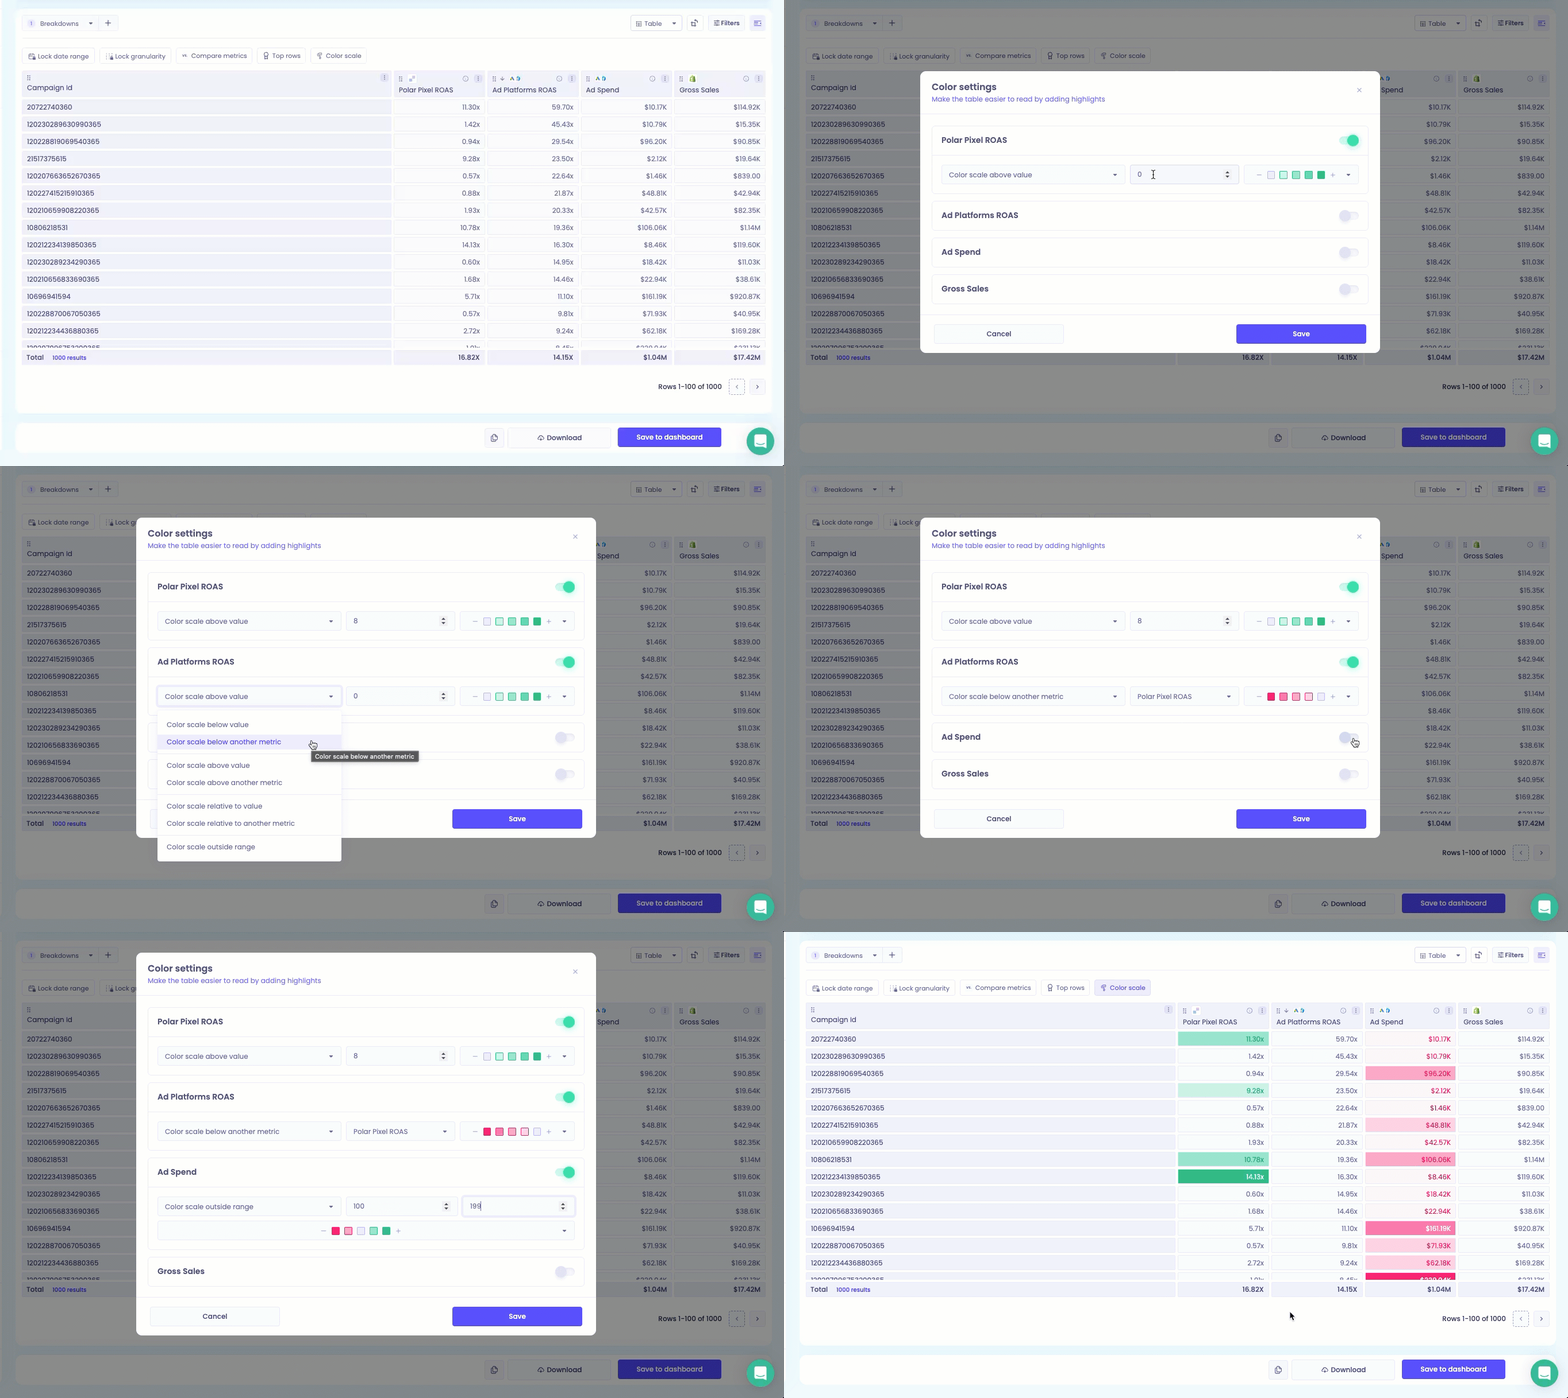
Click Edit on your custom table.
Click the Color Scale icon in the header above the table.
Turn on Color Settings.
Choose the metrics you want to color.
Choose a threshold mode (see below), then set the color and value(s).
Click Save, then Save to Dashboard.
In an Acquisition tab table
Click the Columns and Colors icon at the top of the table.
Turn on Color Settings for the metrics you want to color.
Choose a threshold mode, value(s) and color.
Click Save.
Threshold modes
Mode | When to use it | Example |
Above a value | Highlight strong performance | Green when ROAS is above 3.0 |
Below a value | Highlight underperformance | Red when AOV is below $50 |
Relative to another metric | Compare one metric against another metric in the same table | Green when Net Sales is above Last Year's Net Sales, red when it's below |
Outside of a range | Flag values outside a safe zone | Red when Conversion Rate is below 2% or above 10% |
Note: for Relative to another metric, the metric you're comparing against must be included in the same table.
Colors
Color | Typically used for |
Green | Strong performance or goals met |
Red | Weak performance or risks |
Purple | Neutral highlighting, such as tracking variance or emerging trends |
Colors fade automatically from lighter to darker shades depending on where each value falls in the range. In single-direction modes (above or below a value), you can also adjust which direction the color fades.