Google Sheets
Last updated: October 28, 2026
The Google Sheets connector lets you import data into Polar that doesn't come from one of your connected platforms, such as offline marketing spend, operational expenses, product costs or data from tools Polar doesn't integrate with.
This article covers choosing a template and connecting your sheet. For the column rules for each template, see Google Sheets template requirements. If something isn't working, see Troubleshooting Google Sheets.
Tip: the fastest way to get started is to describe the data you want to bring in to Ask Polar. It can point you to the right template and help you map your columns.
Choose a template
Every Google Sheets import starts from a Polar template. Pick the one that matches your data:
Template | Use it for |
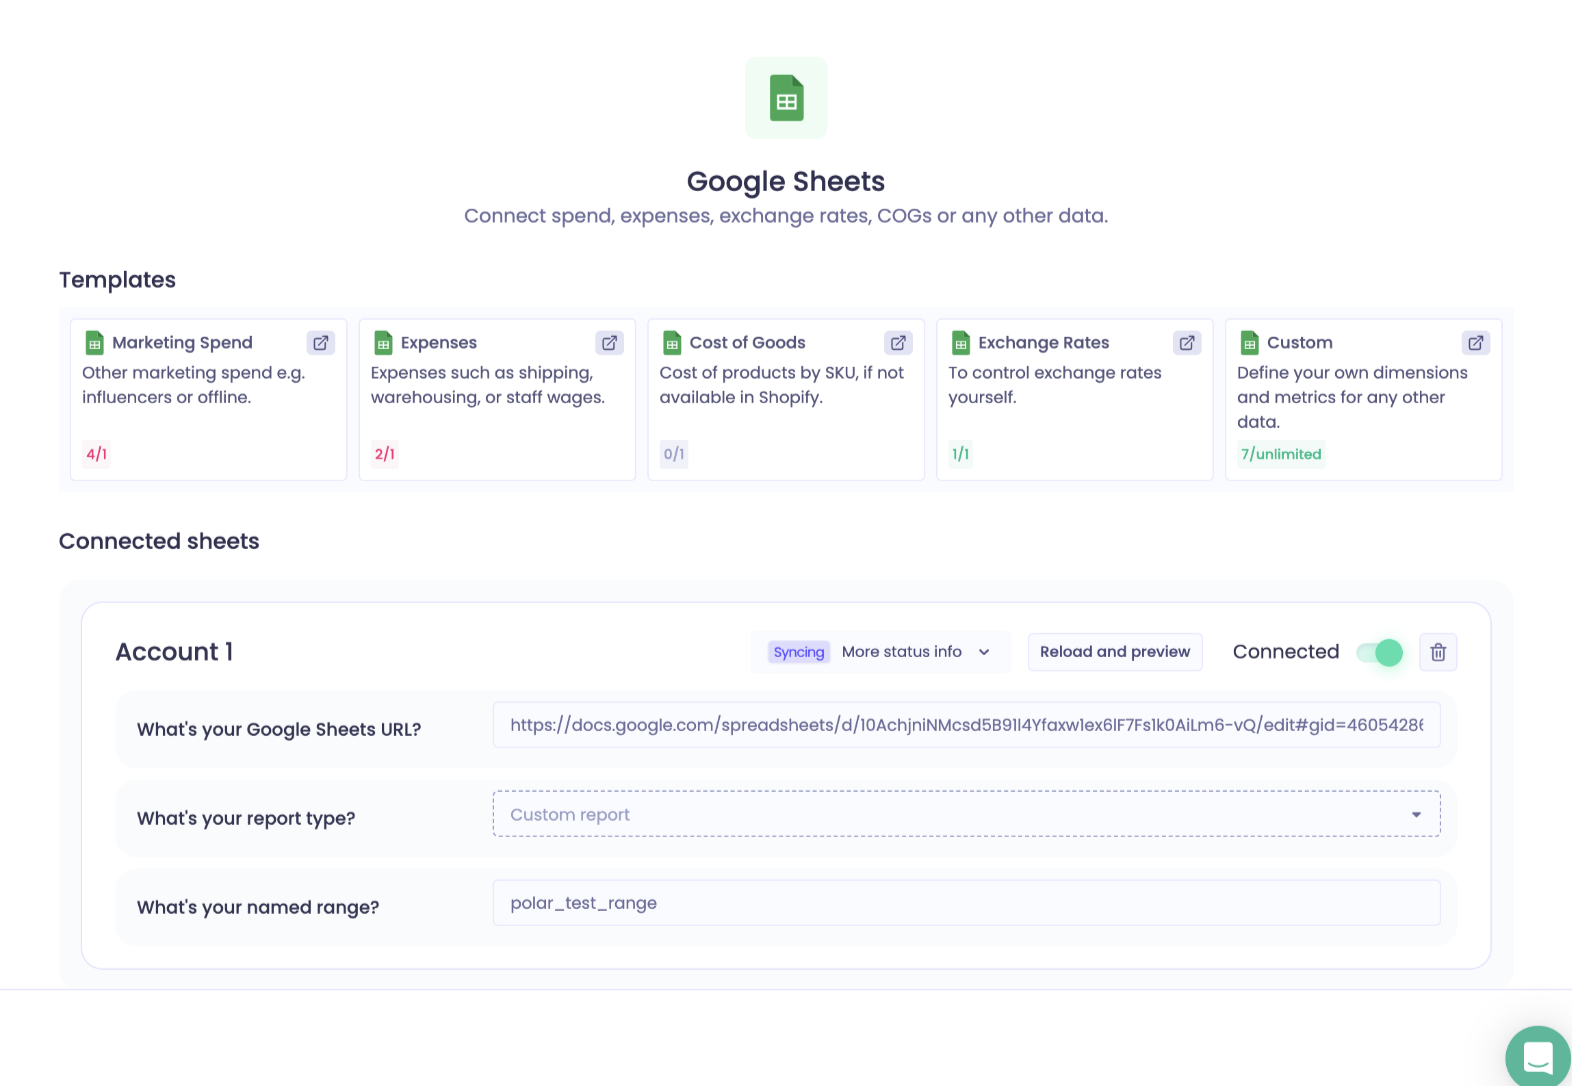
Spend from channels Polar doesn't connect to, such as influencers, affiliates or offline media. Included in blended metrics like Total Marketing Spend. | |
Operational expenses you want included in profit metrics. | |
Product costs by SKU. | |
Custom exchange rates for specific days and currencies. | |
Anything else, such as supplier sales, subscription data from unsupported tools, or custom targets. |
Connect your sheet
Step 1: Copy and fill in the template
Open the template you need and go to File › Make a copy. Give it a name you'll recognize, such as "Your Company – Polar Import".
Delete the example rows and add your data, following the template requirements.
Go to Data › Named ranges and copy the range name (by default,
polar_test_range). You'll need it in Step 3.
Step 2: Open the Google Sheets connector
Go to the Connectors page in Polar.
Find Google Sheets and click Connect to Polar Analytics.
Sign in with Google and authorize Polar to access your sheets.
OR Use Ask Polar to help you connect and review the sheet (this replaces all the next steps)
Step 3: Add your sheet
Paste your sheet's full URL into the Sheet URL field, including the
/edit#gid=part.Select the Report Type that matches your template (for example, Marketing Spend).
Paste the Named Range you copied in Step 1.
Follow the prompts to finish setup.
Step 4: Check that your data imported
The first sync can take up to 24 hours. Then:
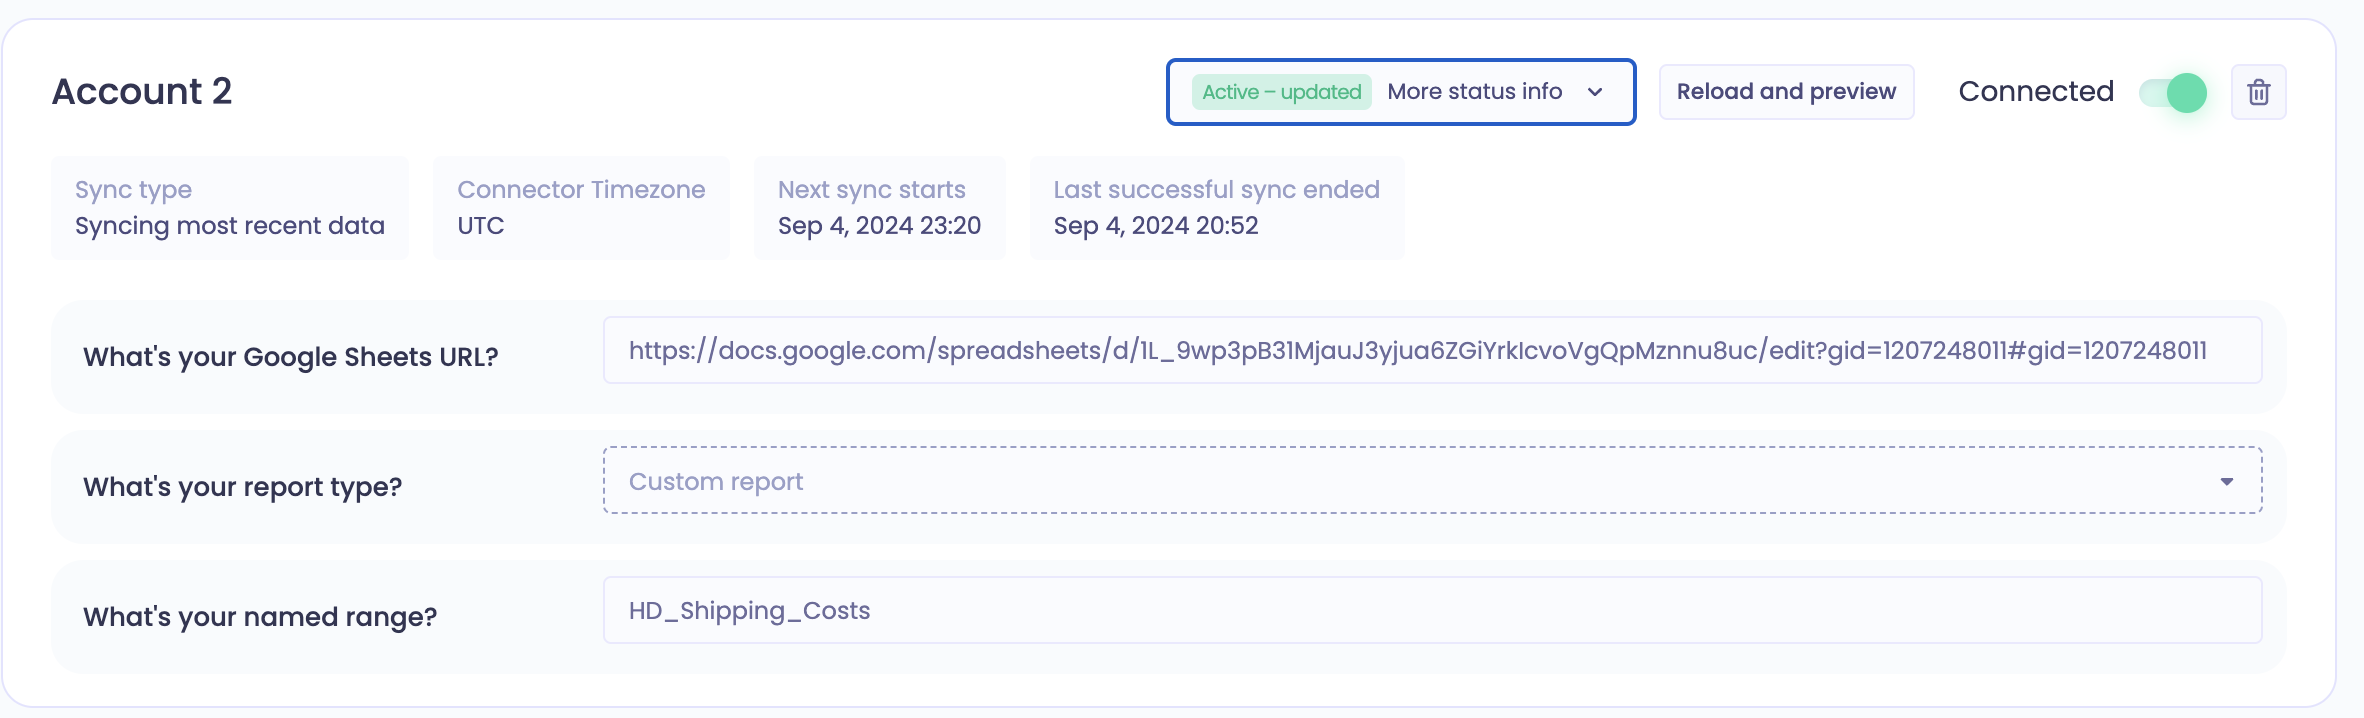
On the Connectors page, click Configure on Google Sheets and check that the status shows Connected.
Use Preview Data to see what was imported.
Check that your data appears where you expect it:
Any template: in a custom table, "Google Sheets" should appear as a source when you add metrics.
Marketing Spend: your channels and campaigns should appear in the Acquisition tab.
Expenses: choose whether to deduct them from Total Sales in Data Settings.
Keep your data up to date
Polar syncs your sheet automatically. To import changes straight away, open the connector with Configure, click Reload and preview, then Start sync.
Best practices:
Add data daily rather than aggregating by month or year.
Use one sheet per data structure. If you're adding the same kind of data for several stores or countries, put it all in one sheet and use a dimension column to tell them apart.
Keep metric names unique across all your connected sheets. If two sheets share a metric name, only one is imported.
Replace or remove a sheet
On the Connectors page, open the Google Sheets connector.
Click the trash icon next to the sheet you want to remove.
To replace it, connect the new sheet by following the steps above. You'll also need to do this if your sheet's URL changes.
Need help? Reach out through the in-app chat and ask to speak with an agent.