Understanding Key Metric Card comparisons
Last updated: October 23, 2026
Each metric on a Key Metrics Card shows a percentage in its bottom-left corner. It compares the current value with the comparison period set in your date filter, such as the previous period or the previous year.
How the percentage is calculated
Polar uses this formula:
(Current value ÷ Previous value) − 1
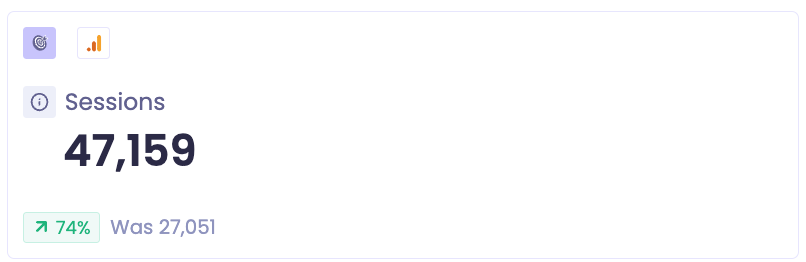
For example, if sessions go from 27,051 to 47,159, the change is (47,159 ÷ 27,051) − 1 = 74%.
What the colors mean
Color | Meaning |
|---|---|
Green | The change is good for your store |
Orange | The change is bad for your store |
Whether an increase is good depends on the metric. More sessions is good, so an increase shows in green. More returns is bad, so an increase shows in orange.
Examples
Metric | Previous | Current | Change | Color | Why |
|---|---|---|---|---|---|
Sessions | 27,051 | 47,159 | +74% | Green | More visitors |
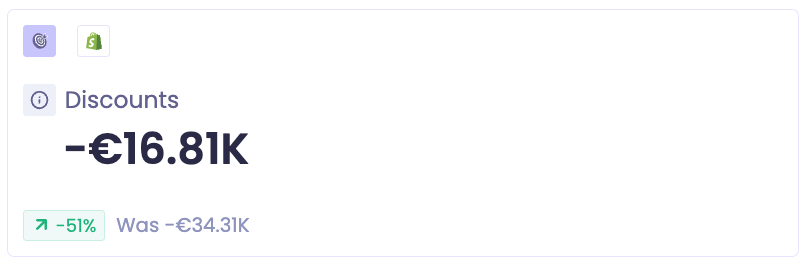
Discounts | -€34.31K | -€16.81K | -51% | Green | Less given away in discounts |
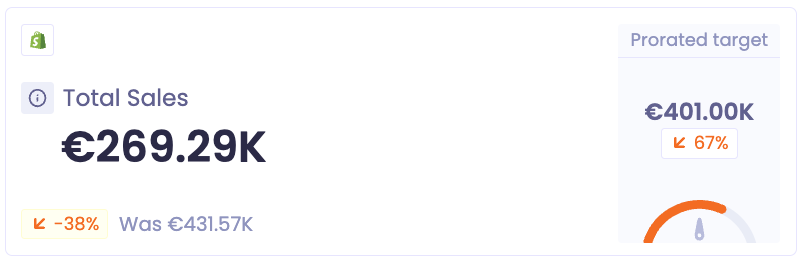
Total Sales | €431.57K | €269.29K | -38% | Orange | Lower sales |
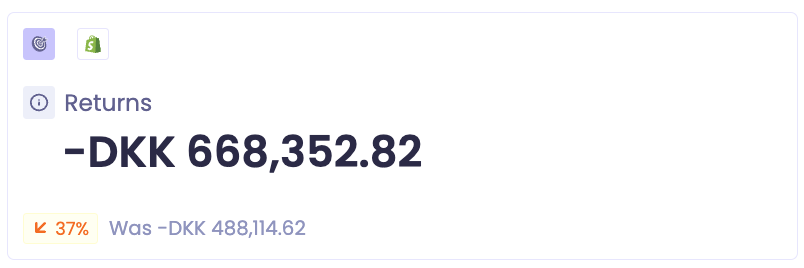
Returns | DKK 488,114.62 | DKK 668,352.82 | +37% | Orange | More returns |
To change what you're comparing against, see Comparing time periods.