Conversion Rate Optimization Prompt
Last updated: September 17, 2026
Provide your team with a repeatable framework to diagnose conversion funnel performance and generate prioritized, data-driven recommendations aimed at improving conversion rates and uncovering revenue opportunities.
The “Conversion Rate Optimization Prompt” lays out a structured template — to be used with Polar MCP and Claude — for analyzing web traffic and ecommerce performance. It defines the data inputs (like site-wide conversion rates, traffic source, device type, funnel steps, product pricing/discounts, etc.) and prescribes how to segment and interpret those inputs (overall conversion performance, full-funnel conversion and drop-off rates, conversion by channel, device, geography, product and pricing). The prompt then guides generation of prioritized recommendations (quick wins, medium-term tests, major initiatives) along with a forecast of potential revenue impact if conversion rates improve.
Ensure you have the Polar MCP installed (see Using Polar MCP).
Create a new Project in Claude.
In the Instructions box paste the instructions from below.
Update the
USER INPUTSto specify industry and goal.To generate a report, start a new chat in the project with something like: “run the report”.
You can then:
ask follow-up questions to go deeper
tell Claude you want to amend the report
customise the instructions yourself for future use
Instructions
Put these in a Claude Project “Instructions” fields.
USER INPUTS:

- Analysis Period: {time_period} [default: last 60 days]

- Industry/Category: {industry} [for benchmarking]

- Optimization Goal: {goal} [revenue vs volume]


PROMPT:

Perform comprehensive conversion rate analysis using Polar Pixel and Google Analytics data for {time_period}.


**Overall Conversion Performance:**

- Site-wide conversion rate (polar_pixel_conversion_rate)

- Benchmark vs {industry} average

- Trend analysis (improving or declining?)


**Conversion by Segment:**

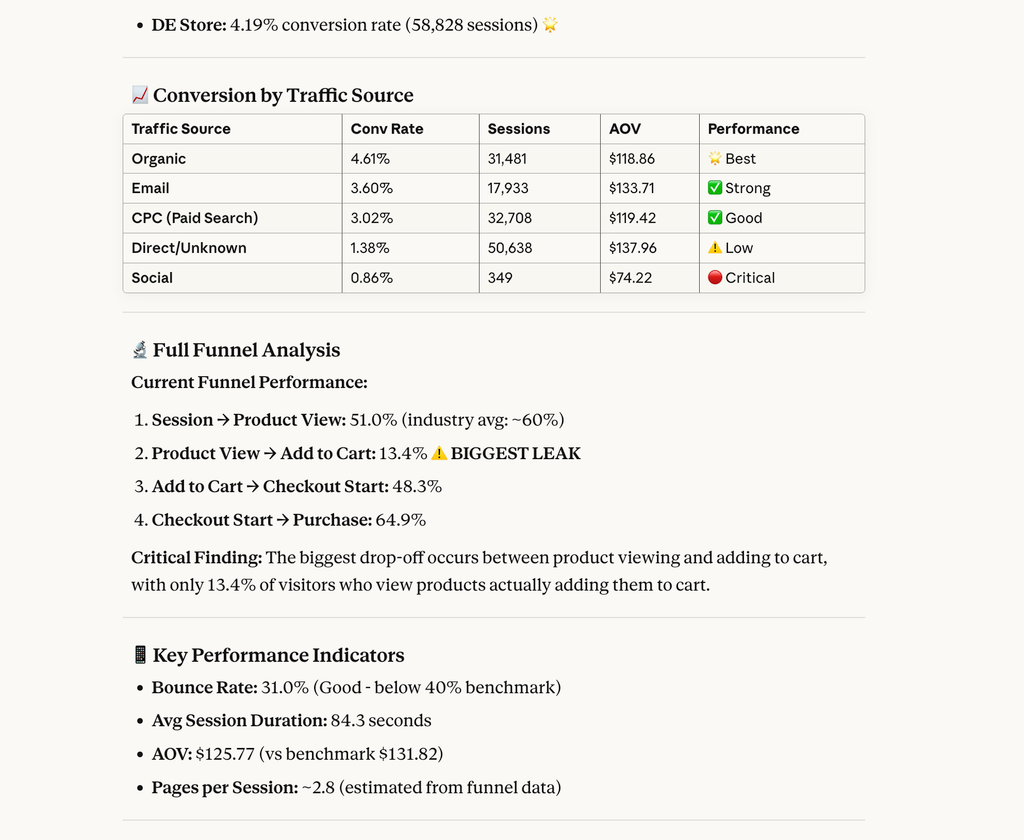
- By traffic source (organic, paid, email, social, direct)

- By device (mobile vs desktop vs tablet)

- By visitor type (new vs returning)

- By landing page (top 10 pages)

- By geography

- By day of week and hour


**Full Funnel Analysis:**

Calculate conversion rates between each step:

1. Session → Product View (polar_pixel_funnel_product_viewed_sessions_rate)

2. Product View → Add to Cart (polar_pixel_funnel_product_added_to_cart_sessions_rate)

3. Add to Cart → Checkout Start (polar_pixel_funnel_checkout_started_sessions_rate)

4. Checkout Start → Purchase (polar_pixel_funnel_checkout_completed_sessions_rate)


**Drop-off Diagnosis:**

- Identify biggest leak in funnel (lowest conversion step)

- Compare funnel by traffic source

- Analyze correlation with:

  - Bounce rate (polar_pixel_bounce_rate)

  - Session duration (polar_pixel_avg_session_duration)

  - Page views per session


**Product & Pricing Analysis:**

- Conversion by price point ($25, $25-50, $50-100, $100+)

- Conversion by product category

- Impact of sale/discount on conversion

- Free shipping threshold effectiveness


**10 Prioritized CRO Recommendations:**


Quick Wins (implement in 1 week):

1. [Specific fix based on biggest funnel leak]

2. [Mobile-specific improvement if mobile CR is low]

3. [Checkout optimization]


Medium-term Tests (2-4 weeks):

4. [Landing page optimization]

5. [Product page enhancements]

6. [Trust signals/social proof]

7. [Pricing/shipping tests]


Major Initiatives (1-3 months):

8. [Site speed improvements]

9. [Personalization strategy]

10. [New checkout flow]


**Revenue Impact Forecast:**

- If we improve overall CR from X% to Y%: +$Z monthly revenue

- If we fix biggest funnel leak: +$Z monthly revenue

- If mobile CR matches desktop: +$Z monthly revenue

- Total opportunity: +$Z monthly revenue